Imagine you are starting a new project, and you need to develop the schedule as soon as possible, but you do not have a template. What would you do? Do you ask a friend for help? Or develop your project without a template? Ahh, you download one from the internet, but does it fit what you and your project need?
There are a variety of tools and applications for project planning. However, one of the most used, least expensive, easiest to customize work tools is the Gantt chart in Excel. Did you know that we have a Gantt chart template?
Well, you are in the right place. This article will let you know our Gantt chart template’s characteristics and how easy it is to use through an example.
Key Elements of the Gantt Chart Template
The Gantt Chart
The Gantt chart is an essential tool for a Project Manager in planning, scheduling, and managing tasks, simplifying even the most complex projects. Besides, it allows you to have a big picture of scheduled tasks and project progress. The Gantt chart is your faithful ally to have control and productivity in the execution of projects. Likewise, it keeps the team coordinated and engaged.
Nowadays, there are many types of specialized software and applications for this purpose. However, a good number of companies around the world prefer to continue using Excel. Why? You can easily share the template in different formats, such as Excel or PDF, among the interested team members as appropriate.
Work Breakdown Structure — WBS
Another pivotal aspect in using the Gantt chart is the Work Breakdown Structure (WBS).
The PMI defines a WBS as follows: “It is the hierarchical decomposition of the total scope of work to be carried out by the project team to accomplish the project objectives and create the required deliverables” (see Project Management Institute [PMI], 2019).
The best way to understand and manage a complex task is to break it down into its parts. Here is an analogy — You want to eat a watermelon, so you will need to cut it into small pieces to eat it all. So is a project — the sum of all the WBS tasks; a task not contained in the WBS is not part of the project. Any additional tasks require authorization to order the change.
The WBS is unique for each project. It consists of deliverables and work packages; some projects integrate phases. At other times the project may be more straightforward and consist of a deliverable and all the tasks to be developed. The WBS will be created by the project team and will have several levels according to its complexity and criteria.
Each task has a unique identification code according to the corresponding level within the WBS. For example, Level 1 represents the scope of the work project required to create the product, service or result.
Level 2 is the first level of decomposition for the Project. Generally, the second level corresponds to integration and project management work—for example, the Project phases, significant deliverables, or releases in Agile life cycles. The numerology for the second level is 1.1, 1.2,…., 1.n.
Level 3 and lower levels use the previous numerology adding a point and the corresponding number, that is: 1.1.1, 1.1.2,…, 1.1.n; 1.2.1, 1.2.2,… 1.2.n; 1.3.1, 1.3.2,…, 1.3.n.
Levels are determined at the discretion of the Project Manager and the project team.
Don’t forget that!
When you manage your template daily and update it, you will be able to know your project’s current status and take action when there are changes from what was actually planned. Thus, you avoid and mitigate risks in advance, achieving control of your project.
Features of Our Gantt Excel Template
The Gantt Chart in Excel allows you to work on small and medium projects. You don’t need to be an expert to utilize it. You need a basic knowledge of Excel use, such as adding rows and columns and copying data from one cell to another. But you can go further, such as linking dependent tasks if you feel comfortable with using formulas; our template has a help tab where you find information about this.
Among the characteristics to be highlighted are:
- Fast-entry with WBS outline numbering
- Tasks shown on the Gantt view
- Automatic scheduling of tasks respecting holidays and weekends
- Linking of dependent tasks
Assigning a person responsible for each task
Our template’s advantage is that you have a quick guide to use, which shows you how to customize some characteristics to suit your needs and those of your project. Also, there is a support service link if you need it.
Let’s Start Using our Gantt Chart Template
For this purpose, I took a real project, and it was adapted for this example. The company Global Telecom Corp was awarded the project for the design and implementation of a data center. It created the following WBS.
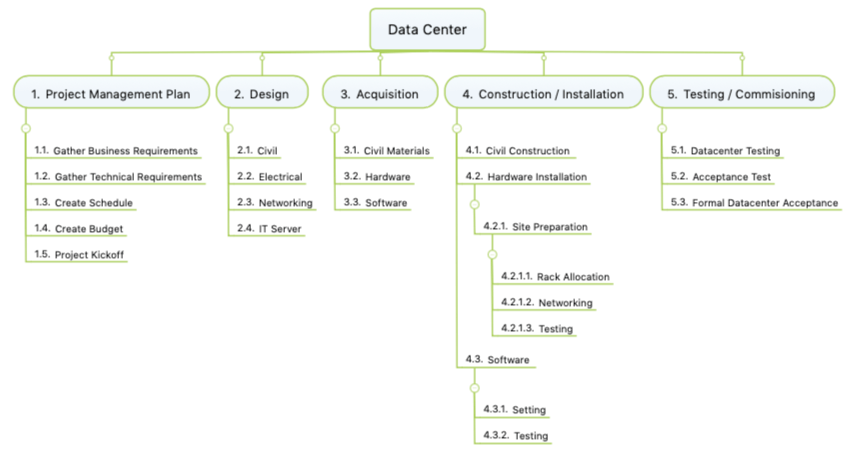

The WBS will be essential to fill out our template and will ensure that the template has all tasks, milestones, and dependencies identified by the project team. Below I will list what to do step by step:
- General Project Information — Enter the project, leader or Project Manager, and client name.
- Informative note not to forget — Look for additional information and a quick guide in the Help tab.
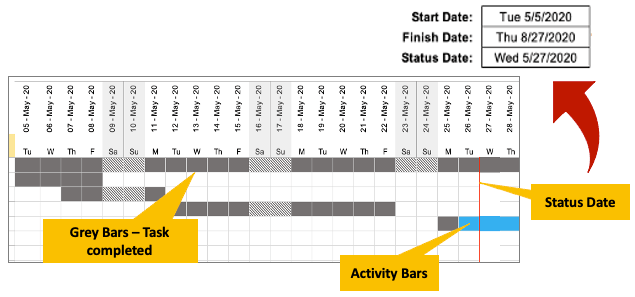
- Dates — Manually enter the start date. The project finish date will automatically update with the latest finish date of the configured tasks. The status date is the date you are reviewing the Gantt Scheduler, and it is entered manually.

4. Enter the tasks and sub-tasks.
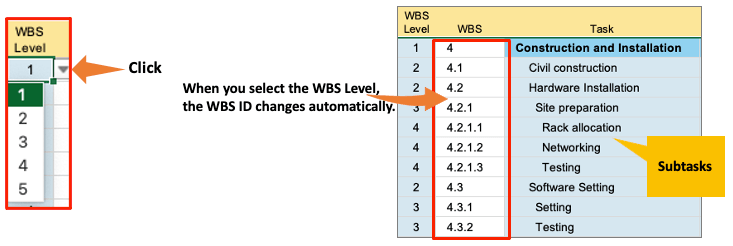
5. Enter each task level by clicking on the WBS Level column, and the levels for the sub-tasks will be displayed.
6. When you select the WBS level, the WBS column will automatically place the numbering in sub-levels.
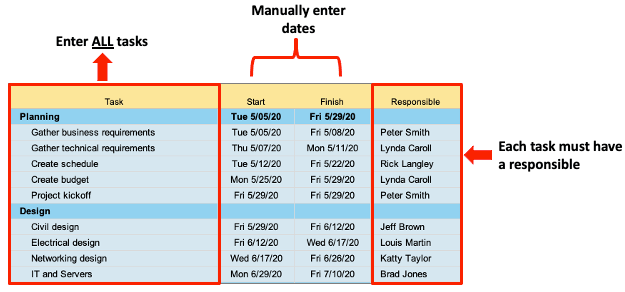
Manually enter the start and end dates for each task and subtask. Note: Dates are logged in the following order D / M / Y but will be reflected as a week day, M / DD, YYYY. What for? The PM or stakeholder who is reviewing the template can quickly identify the day of the week.
Each task has a person responsible. Please fill in the full name. That person will be in charge of the work running successfully.
Each task must have a unique ID. The ID appears in the template under the related WBS level.
When you tab over a WBS level cell, the WBS column changes automatically.
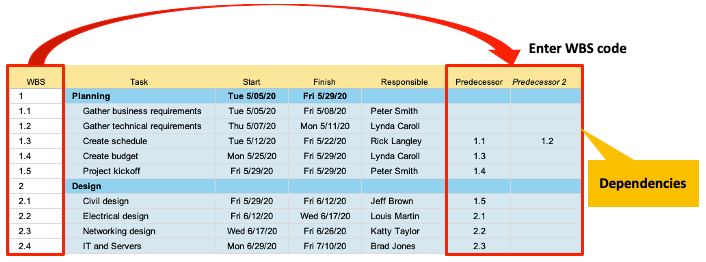
Now that the tasks are already registered, as well as the start date and finish date planned, you must enter the predecessors. For example, task 1.3, “create Schedule”, can’t start until tasks 1.1 and 1.2 have finished. Thus, the schedule can’t be created until all technical and business requirements are met.
And how is the status of my project?
The majority of Project Managers prefer to see % progress on tasks and see which tasks have already been completed and which have not. There is not much time to analyze each column.
Remember! The success of this diagram is the daily update. And this is your responsibility as a Project Manager.
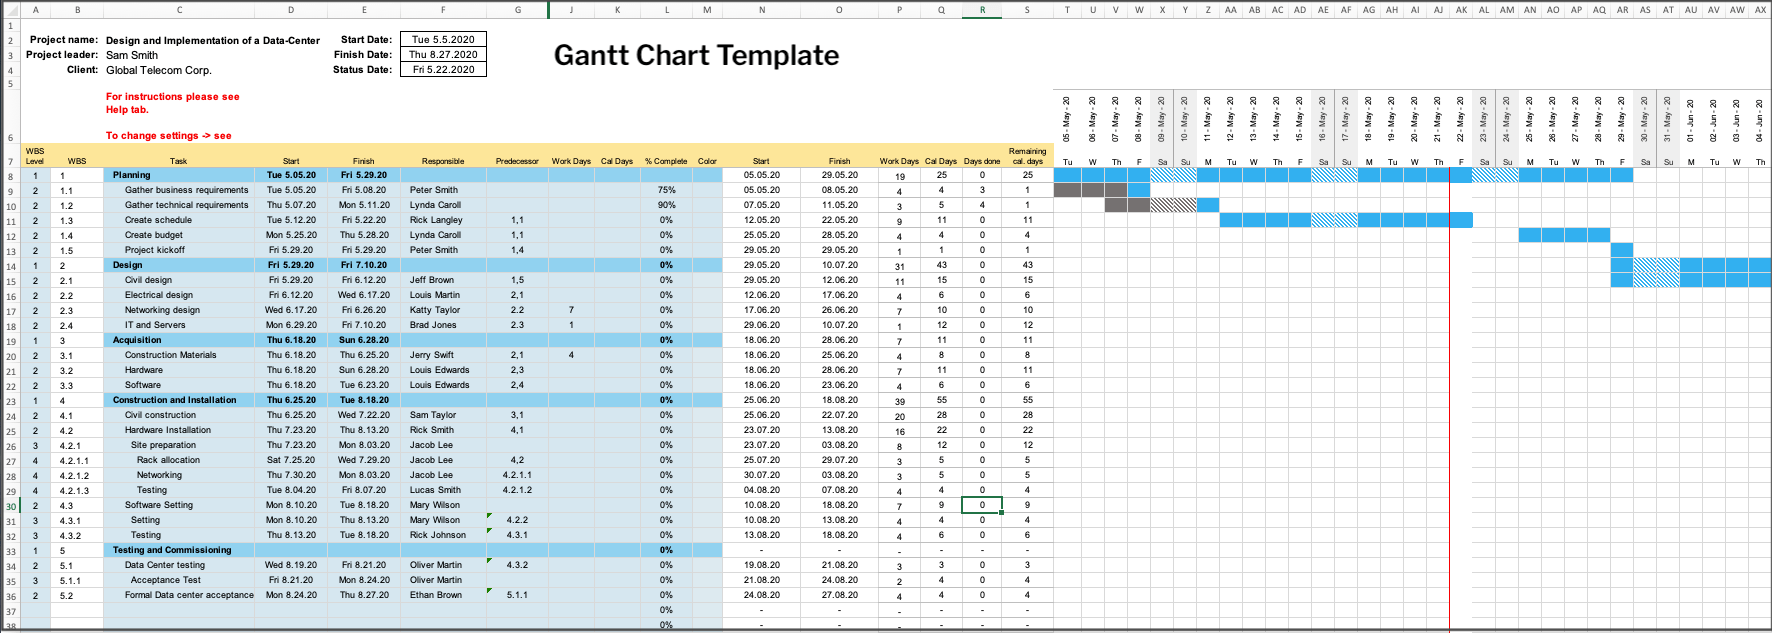
Gantt Chart Template Overall View — After entering all previous information, we obtain a big picture of our project progress in a Gantt chart. The timeline is a valuable aid to visualize the project’s status during a certain period quickly. The Project Manager will identify which tasks are completed within the set dates, which tasks are progressing, and which ones are delayed. Having a complete overview of the project’s status will allow you, as the project leader, to prevent risks and make timely decisions.
Viewing our Timeline —You will be able to see the project progress. Gray bars are 100% completed tasks. The blue bars are tasks that are running. There is a vertical red line that corresponds to the date you are reviewing your schedule. That helps you see your progress to date and not get distracted by tasks scheduled for the future.
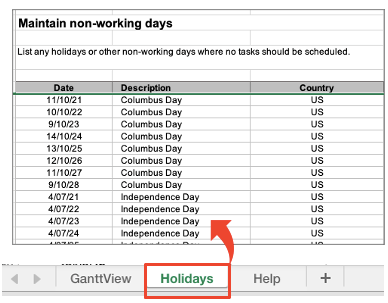
Holidays — Enter the calendar of holidays and non-working days for your country. This information is relevant in the formulas so that the timeline is accurate
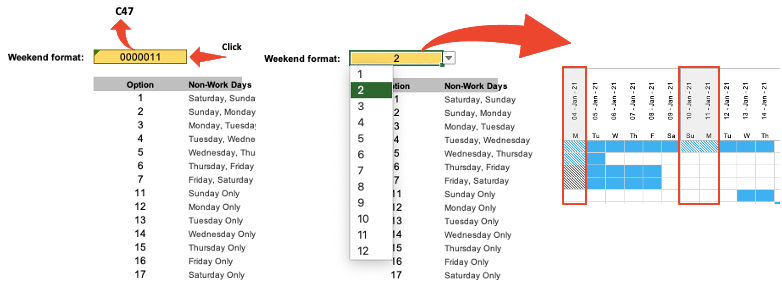
What about holidays or weekends?
It is simple! The Gantt scheduler allows you to specify the weekend days based on your local calendar. By default, Saturday and Sunday are weekend days, and no work will be scheduled on these days. But you can also define other days as non-working / weekend days using the entry field further down. In the help tab, you can go to cell C47 and click; the options bar will be displayed, select the weekend days option, and automatically update it in the Gantt view.
The day of the week starts on Monday. How do I change the rule?
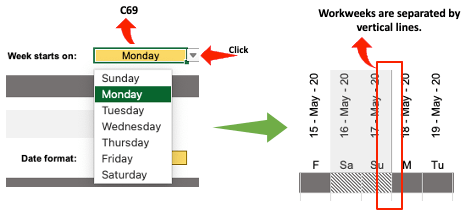
Very easy. A vertical line separates each workweek. This line indicates when the workweek begins. By default, the template presents Sunday as the starting day of the week. If your week starts on Monday, go to cell C69 of the help tab and click, then the week’s days will be displayed, select Monday, and see the change in the timeline view.
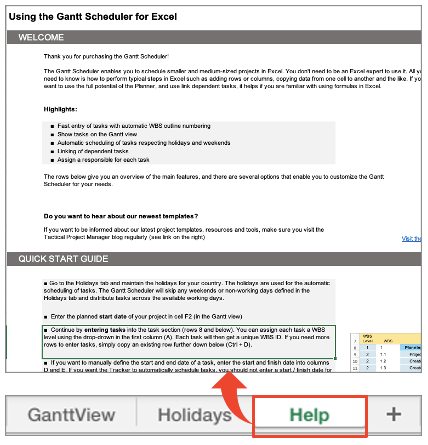
Help tab — This tab explains simply and comprehensively how to use the template without complications. The help includes an introduction, a description of the main features in the template, a quick guide for use, and instructions for how to change non-working days and the first day of the workweek. Furthermore, you can customize it by formatting the dates, linking the dependent tasks, highlighting tasks that are approaching the final date and have not yet been completed, and adding Lags for dependencies.
In case you have questions, at the end of the help tab is the link to contact support.
You saw how easy the tool is and how you can quickly adjust it to your project and customize it according to your needs! You realized that what requires the most work is entry of formulas, and they are done already! Also, you can feel comfortable that have support in case you need it.
To conclude, the success of the template will depend primarily on you. Creating the WBS with the tasks and subtasks in addition to determining the dependencies and milestones of the project are vital aspects in the Gantt chart. Keeping it updated and achieving continuous communication will help the team to be coordinated and engaged. With the Gantt Scheduler, you can gain control and productivity of your project.
Get the Gantt Chart Template for Excel
Here you can purchase your copy of the Gantt Chart Template for Excel. You will receive an unlocked and unrestricted Excel file that you can start using right away.
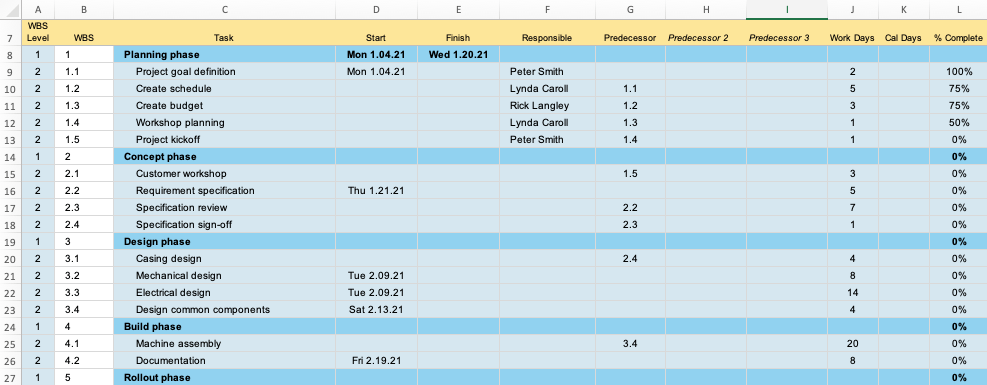
Gantt chart:

Author
-

Liliana is a Project Professional with a background in Electronic Engineering with extensive business and technical project management experience within the IT and telecommunications industries. She writes for Tactical Project Manager about her favorite topics, which include stakeholder management, leadership and communication.
View all posts


